Ahead of the 2024 election, we examined how South Africa has done on several important measures over the past few decades. We looked at the following topics
- murder;
- unemployment and how it has changed since 2000;
- social grants and how coverage has changed since democracy;
- state provision of housing; and
- HIV and life-expectancy.
Murder and crime
Crime consistently ranks as one of the two major concerns of South Africans, along with unemployment. But other than murder, crime rates are hard to measure because many crimes go unreported. Murder is both the most serious and best measured crime. It’s a proxy for how we’re doing on crime generally. Unfortunately the country is regressing.
From 1995 until about a decade ago South Africa was making headway. The murder rate was dropping. But for the past decade it has steadily got worse.
| Year | Murders | Per 100k |
| 2012/13 | 16,213 | 31 |
| 2013/14 | 17,023 | 32 |
| 2014/15 | 17,805 | 33 |
| 2015/16 | 18,673 | 34 |
| 2016/17 | 19,016 | 34 |
| 2017/18 | 20,336 | 36 |
| 2018/19 | 21,022 | 37 |
| 2019/20 | 21,325 | 37 |
| 2020/21 | 19,972 | 34 |
| 2021/22 | 25,181 | 43 |
| 2022/23 | 27,272 | 46 |
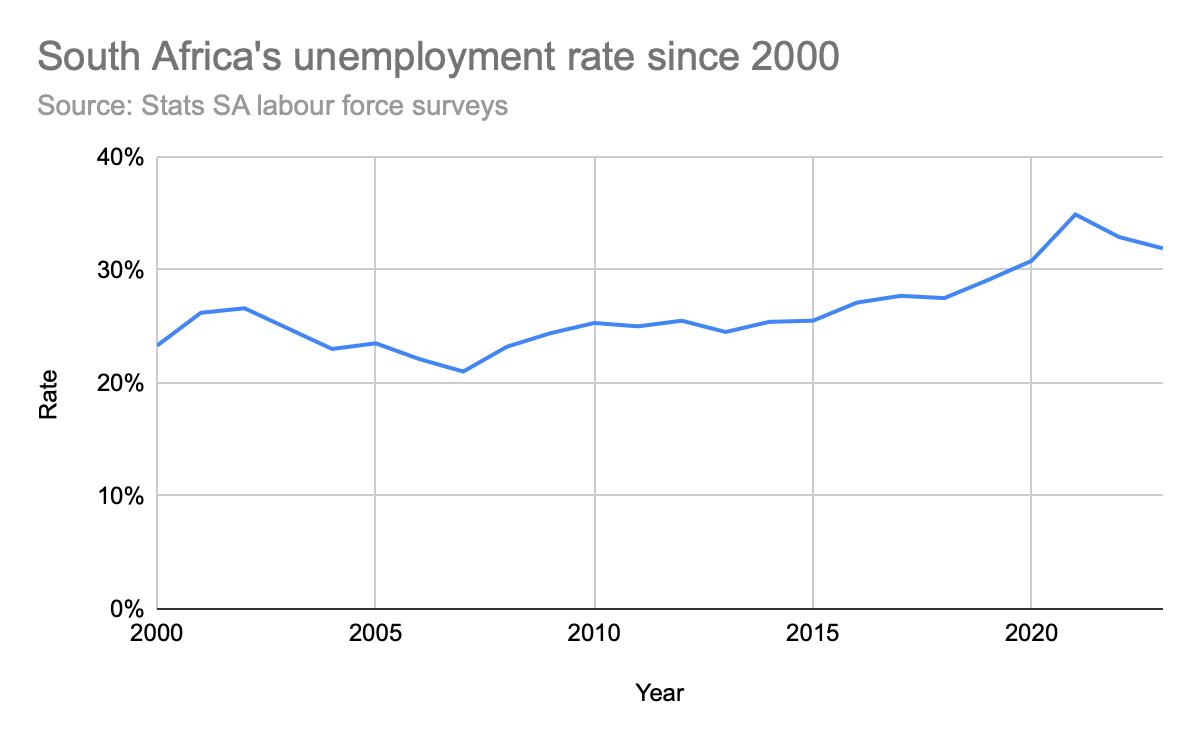
Unemployment
Our chronic, most pressing problem that we have failed to fix is unemployment.
Social grants
In the face of massive unemployment, the social grant system helps millions of people in South African to survive. Without it the country would be plunged into chaos. The following graph shows how the number of grant recipients has increased since democracy.

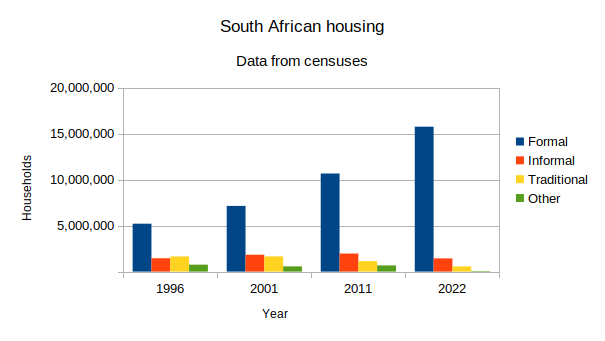
Housing
The Reconstruction and Development Programme of the ANC in 1994 was its flagship programme and promised to provide everyone with houses. While much progress was made, there is still a long way to go. We found that the quality of data was unexpectedly poor, especially the 2022 census that was published this year.
HIV and life-expectancy
We examined how antiretroviral treatment has reversed the country’s decline in life-expectancy. The following graph of South Africa’s change in life-expectancy since the late 1980s and projected to 2030 is quite extraordinary. One would be hard-pressed to find a country in the world with life-expectancy as volatile as this. The first dip was due to the HIV epidemic. The second, much shorter one, was due to Covid. The good news is that life-expectancy appears to be on a sustained upward trajectory.

The original version of this article used the table of murders for the Western Cape. We’ve changed it to be for the whole country.
This article was first published on GroundUp
The post South Africa: key statistics ahead of the 2024 elections appeared first on The Mail & Guardian.
Here is how we’re doing on unemployment, murder, housing, life-expectancy and social grants
The post South Africa: key statistics ahead of the 2024 elections appeared first on The Mail & Guardian.